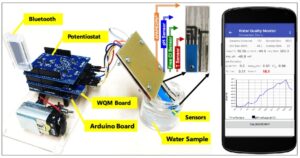
It is difficult to obtain clean drinking water in rural areas of the least developed countries. Existing low-cost water filtration systems are not accompanied by a simple but effective method for monitoring water quality.
Here, we demonstrated a straightforward optical method for measuring the number of impurities in water that have not dissolved. In this study, we compared four distinct water samples and determined that this method is capable of measuring the invisible particles in water.
Our low-cost measurement system can be constructed and operated by nonspecialists, allowing for convenient monitoring of the physical water quality in impoverished rural areas and the wilderness. Based on our experimental setup, we also proposed a design for a reliable, portable, and inexpensive measuring device. This device can be rapidly transferred to assembly lines, drastically improving the lives of rural citizens.
The outline of research paper will be:
I. Introduction
- Background information on the lack of clean drinking water in rural areas of least developed countries
- Overview of existing low-cost water filtration systems and their limitations
- Description of the need for a simple but effective method for monitoring water quality
- Research question and objectives
II. Literature Review
- Review of literature on the challenges of obtaining clean drinking water in rural areas
- Overview of current water filtration and monitoring technologies
- Examination of existing optical methods for measuring impurities in water
III. Methodology
- Description of the experimental setup and equipment used in the study
- Overview of the four distinct water samples used in the study
- Detailed explanation of the optical method used for measuring the number of impurities in water
IV. Results
- Presentation of the results obtained from the four water samples
- Comparison of the measured impurities in each sample
- Discussion of the effectiveness of the optical method and its potential as a low-cost water quality monitoring tool
V. Proposed Design for a Portable Water Quality Monitoring Device
- Description of the proposed design for a reliable, portable, and inexpensive measuring device
- Discussion of the potential impact of such a device in impoverished rural areas and the wilderness
VI. Conclusion
- Summary of the research findings
- Implications of the research for addressing the lack of clean drinking water in rural areas
- Future research directions
VII. References
- List of sources cited in the paper
Possible Solution?
Arduino is a popular microcontroller platform that is widely used in hobbyist and educational projects, including environmental monitoring and sensing. Here are some suggested sensors and components that you can use with an Arduino for your water quality monitoring project:
- Optical sensor: You can use a photodiode or phototransistor as the light sensor for your optical measurement system. These sensors are available in various sizes and packages, and can be easily connected to an Arduino’s analog input pins using a simple voltage divider circuit. Alternatively, you can use a light sensor module that includes an integrated amplifier and ADC, such as the TSL2561 or the BH1750. These modules can communicate with an Arduino using the I2C protocol and provide calibrated digital output.
- Laser diode: You can use a low-power laser diode as the light source for your optical measurement system. These diodes are available in various wavelengths and output powers, and can be easily controlled using a simple transistor switch. Alternatively, you can use a laser driver module that includes built-in current control and modulation features, such as the LM317-based laser driver by David Johnson-Davies.
- Power supply: You will need a stable power supply to power your Arduino and sensors. You can use a battery pack, such as a 9V battery or a set of AA or AAA batteries, or a USB power bank. Alternatively, you can use a regulated power supply module that can output a stable voltage and current, such as the LM7805 voltage regulator or the LM2596-based DC-DC converter module.
- LCD display: You can use a simple LCD module to display the measurement results and other information. These modules are available in various sizes and formats, and can communicate with an Arduino using the SPI or I2C protocol. Alternatively, you can use a small OLED display module that offers higher resolution and contrast, such as the SSD1306-based OLED module.
- Other components: You may also need some additional components such as resistors, capacitors, and jumper wires to connect the sensors and display to the Arduino. It is recommended to use high-quality components and follow best practices for circuit design and layout to ensure reliable and accurate measurements.
How to connect?
Circuit:
- Connect the anode of the photodiode to the analog input pin A0 of the Arduino, and connect the cathode to the ground through a 10 kOhm resistor.
- Connect the laser diode to a digital output pin D2 of the Arduino, and connect the other end to the ground through a 220 Ohm resistor.
- Connect the Vcc and GND pins of the LCD display module to the 5V and GND pins of the Arduino, respectively. Connect the SDA and SCL pins of the display to the corresponding pins A4 and A5 of the Arduino
#include <Wire.h> // include Wire library for I2C communication
#include <LiquidCrystal_I2C.h> // include LiquidCrystal_I2C library for LCD display
LiquidCrystal_I2C lcd(0x3F, 16, 2); // create LCD object with I2C address and size
int laserPin = 2; // digital pin for laser diode
int photoPin = A0; // analog pin for photodiode
void setup() {
lcd.init(); // initialize the LCD display
lcd.backlight(); // turn on the backlight
pinMode(laserPin, OUTPUT); // set laser pin as output
digitalWrite(laserPin, LOW); // turn off the laser
delay(1000); // wait for sensor to stabilize
}
void loop() {
digitalWrite(laserPin, HIGH); // turn on the laser
delay(50); // wait for a short time
int reading = analogRead(photoPin); // read the photodiode voltage
digitalWrite(laserPin, LOW); // turn off the laser
float ppm = map(reading, 0, 1023, 0, 500); // convert reading to ppm scale
lcd.clear(); // clear the LCD display
lcd.setCursor(0, 0); // set the cursor to the first line
lcd.print(“PPM: “); // print the PPM label
lcd.print(ppm); // print the PPM value
delay(1000); // wait for a short time
}
This code uses the analog input pin A0 of the Arduino to read the voltage output of the photodiode, which is connected in reverse bias to detect the scattered light from the laser. The laser is controlled by a digital output pin D2 of the Arduino, which is turned on for a short time to illuminate the sample. The reading is then converted to a parts-per-million (PPM) scale using the map() function, and displayed on the LCD module using the LiquidCrystal_I2C library. The code also includes a delay of 1 second between measurements to allow the sensor to stabilize. Note that you may need to adjust the laser power and exposure time for optimal performance depending on the sample properties and sensor configuration.
To map the values you get from the optical sensor to actual readings of water quality, you would need to calibrate the sensor. Calibration involves comparing the sensor readings with known standard solutions of water quality parameters, such as dissolved oxygen, pH, turbidity, or conductivity, and adjusting the sensor readings accordingly.
Here are the general steps for calibrating an optical sensor:
Prepare a series of standard solutions with known water quality parameters. The solutions should cover the range of expected values for your measurement.
Measure the optical sensor response for each standard solution.
Plot the sensor response against the known water quality parameter values for each solution.
Use a regression analysis or other mathematical model to determine the best-fit equation that maps the sensor response to the water quality parameter value.
Use the equation to convert the sensor response values to actual water quality parameter values.
It’s important to note that calibration should be done periodically to ensure the accuracy and reliability of the sensor measurements. Also, the specific calibration procedure and equations would depend on the type of optical sensor and water quality parameter being measured.


